
Defining “good payment performance” is harder than it sounds.
As soon as you work with multiple PSPs, acquirers, payment methods, and fraud tools, your data fragments.
One provider reports “authorization rate” one way, another includes different decline types, and your view of “cost” rarely matches what a PSP dashboard calls “fees.”
Even within the same business, teams end up using different definitions without realizing it.
So when it comes time to set payment KPIs, the problem usually isn’t a lack of metrics. It’s choosing the right ones, measuring them consistently, and connecting them to levers you can actually pull.
In this guide, you’ll learn which payment metrics are worth tracking and how to turn them into clear, actionable key performance indicators (KPIs).
Primer is a unified payments infrastructure that empowers merchants to unify their whole payments stack under one roof and act on actionable, standardized data within a single dashboard. To learn more about how we can help you A/B test and measure the real impact of your payments strategy, book a call with Primer.
A quick guide on payment metrics
Here are some of the most important payment metrics that merchants need to be aware of:
- Conversion rate: The percentage of customers who start checkout and complete payment successfully. Conversion drops when checkout UX is poor, processing is slow, relevant payment methods are missing, or transactions are declined unnecessarily.
- Authorization rate: The percentage of attempted transactions approved by issuers. Low authorization rates often aren’t about customer intent. They’re usually caused by routing decisions, fraud signals, or missing or inconsistent data, leading issuers to decline payments they might otherwise approve. The result is lost revenue.
- Fraud and chargeback rates: Translate into a percentage of transactions flagged as fraudulent or resulting in chargebacks. Elevated rates directly erode revenue and can expose merchants to scheme monitoring programs, penalties, or even processing restrictions.
- Refund rate: The percentage of processed transactions that result in a refund. High refund rates can signal problems with product quality, customer experience, or even fraud. Refunds also impact reconciliation and cash flow.
- Payments cost: The total payment processing cost across providers and methods. This includes interchange fees, scheme fees, PSP fees, fraud tools, and more. By understanding how much payments cost you, you can effectively balance costs with revenue.
Three mistakes merchants often make when tracking payment metrics (and how to avoid them)
1. Trying to improve all KPIs at once (the “plane cockpit problem”)
Trying to improve every payment KPI at the same time rarely works.
Think of it like sitting in the cockpit of a plane. You push a button, and it turns green. At the same time, though, three other buttons go red.
If you remove 3DS checks where possible, for example, you’ll likely boost approval rates, but as a result of this, fraud and chargebacks might spike quietly a few weeks later.
When you try to push all the buttons too quickly—for instance, by rolling out several payment methods at once—you lose the ability to isolate what’s actually driving performance. One method may underperform in certain regions or introduce higher fraud risk, quietly eating into your margins long before you notice.
In trying to lift overall conversion, you can easily create leakage elsewhere.
That’s the reality of payments: cause and effect are interconnected, so you need to push each button carefully to see what lights up.
What to do instead: Focus on one actionable KPI at a time. Monitor how this change affects other aspects of your payments strategy. Then move on to the next KPI, and repeat the process. This controlled experimentation enables you to draw real insights from specific changes.
Read more: The art and science of A/B testing in payments
2. Treating conversion and cost as if they’re on opposite teams
Another common pattern is merchants “picking a side.” They either become conversion-obsessed or they become cost-obsessed. In reality, both approaches usually end up hurting the overall margin.
When conversion is the only goal, teams often:
- Strip back fraud controls to reduce friction
- Push every transaction down the least-resistant path
- Overlook edge cases where risk is clearly higher
For a while, the numbers look good. Approval rates rise. Top-line revenue grows. Then fraud losses, chargebacks, operational overhead, and scheme fees start to climb. By the time the impact is clear, much of the incremental revenue has already been given back.
The inverse is just as risky. When cost reduction becomes the primary objective, teams may:
- Consolidate volume with one or two “cheapest” acquirers
- Route too aggressively to low-cost rails, even when performance is weaker
- Avoid newer payment methods that carry slightly higher fees but convert better
You may win a fee negotiation, but if authorization rates fall by a few percentage points or customers abandon checkout because their preferred method isn’t available, the hidden revenue loss quickly outweighs the visible savings.
What to do instead: Start from profit per successful transaction, not conversion or cost in isolation. Look at how changes in fraud rules, routing, payment methods, and acquirer mix affect both approval rates and unit economics. The goal is to design flows where higher conversion and healthier costs support each other, rather than treating one as the enemy of the other.
3. Not having a single source of truth for payments
Even when teams agree on what to track, acting on payment data is hard if it lives in silos.
When metrics are spread across PSP dashboards, acquirer reports, and internal tools, patterns are easy to miss. Issues take longer to spot. And comparing performance becomes an exercise in interpretation rather than analysis. especially when each provider uses different definitions, formats, and timeframes.
What to do instead: Use a tool that gives all teams a single source of truth, with normalized and granular data across PSPs that you can act upon.
To gain full visibility into your payments operations within one platform and optimize your strategy based on standardized, actionable insights, book a call with Primer.
How to define what success looks like
In the past, you might have tracked dozens of metrics, compared yourself to competitors with different business models, or celebrated short-term improvements that ballooned into fraud and return spikes months later.
These issues come down to one core problem: many merchants don’t have a clear definition of what “success” means for their business.
A good payment KPI should answer a simple question: what would we do differently this week if this number moves?
Here are some tips on how to effectively define success:
1. Make sure you’re comparing apples to apples
Benchmarking against other merchants can be a useful strategy, but only when the comparison actually makes sense.
Payment performance varies dramatically by vertical and even product type.
Even if two merchants operate in the same vertical, let’s say they sell airline tickets, for example, their payment performance compared meaningfully if one is low-cost and the other premium. Low-cost merchants typically experience higher conversion and higher chargebacks, while premium merchants expect lower volume but lower dispute rates.
So while it’s helpful to understand where your competitors stand, the most meaningful benchmarks come from inside your own business.
Instead of asking what a good conversion rate means in ecommerce, zero in on the questions that are truly important to you, such as:
- Is our conversion trending upward across geographies like X and Y?
- Did last month’s payment routing change actually improve authorization rates for specific markets?
- Are we recovering more failed payments than before?
- Is rising conversion correlated with rising fraud, and if so, are we losing the revenue we gained?
The clearest definition of success is based on your own data over time.
2. Set granular payment KPIs, rather than top-level figures
The best KPIs should be actionable and granular. For instance, high-level metrics like “overall conversion rate” or “payment success rate” are too broad to guide any meaningful decisions. They compress the complexity of your whole payment ecosystem, including different geographies, PSPs, devices, and payment flows, into a single number.
Instead, be more granular:
- Instead of “conversion rate”, track conversion by payment method, country, device, or PSP
- Instead of “authorization rate”, track actionable authorization rate (excluding declines you can’t influence, such as insufficient funds)
- Instead of “chargeback rate”, track chargebacks broken down by reason codes, product types, or customer segments
- Instead of “payment cost”, track cost per successful transaction, split into fees, fraud losses, refunds, and chargeback recovery.
Once metrics get more granular, it becomes far easier to both track and make changes.
One common pitfall to watch out for here is using different definitions for the same KPI across the business. For example, this often happens with “acceptance rate.”
A payments team may treat this as the share of transactions that eventually succeed, including retries and fallback routing. Finance may calculate it as first-attempt approvals only. Risk teams may exclude transactions blocked by fraud rules altogether.
When each team optimizes against a different definition, decision-making becomes more difficult.
3. Collect customer feedback to get insights beyond data dashboards
Data can’t tell you everything. Oftentimes, the fastest insights come directly from customers via support tickets, surveys, and reports. It’s important to pay attention to this feedback, as you don’t want to lose money on problems that could have been easily solved.
If a number of customers tell you that your checkout is confusing, for example, you now have a clearer idea of why cart abandonment is high. Better yet, you know how to solve it: fix your UX.
Payments should never be a growth blocker. If a legitimate customer has the means to pay, they should be able to. And if something is standing in their way, you must know about it as soon as possible.
4. A/B test to see what works for you and optimize your payments strategy based on evidence
If you’re not testing and validating your payments strategy, you’re acting on guesswork, and this slows down growth and introduces more room for error.
A/B testing changes that. It enables you to:
- Isolate one change at a time to fully see cause and effect
- Track both leading indicators (like approval rates) to anticipate how a change is likely to impact the business and lagging indicators (like refund rates) to validate actual outcomes over time
- Detect unexpected trade-offs for specific improvements
- Compare payment routes, PSPs, 3DS required vs 3DS skipped, and so on
With this approach, your payment strategy will be rooted in a measured and evidence-based process. This is likely to speed up growth with fewer surprises and downstream costs.
How Primer helps merchants gain granular visibility into their payment operations and track the right payment metrics
For many merchants, payment data is fragmented across PSP dashboards and systems. Each provider speaks a different language, and every time you try to make sense of it all, you’re forced to stitch together a dozen silos just to answer a simple question about performance.
This is one of the main reasons merchants can’t optimize their payment strategy effectively: you can’t fix what you can’t see.
Primer was built to change that. When we entered the market, people referred to us as an orchestrator. But orchestration was never the vision: our goal is to give you one platform that enables you to manage every aspect of how money moves across your business.
Here’s how Primer can help merchants track the right payment metrics and simplify workflows:
Act on a single source of truth across all PSPs and track key payment metrics in near real time
With 400+ data points per payment, Observability unifies your whole payment flow into one dashboard.
And with 30+ filters to slice your data by, you can easily understand and present your data.
Track payment metrics like approval rates by processor, region, or payment method, measure the impact of every optimization, and turn raw data into actual insights that help you make better-informed decisions: all with minimal engineering effort.
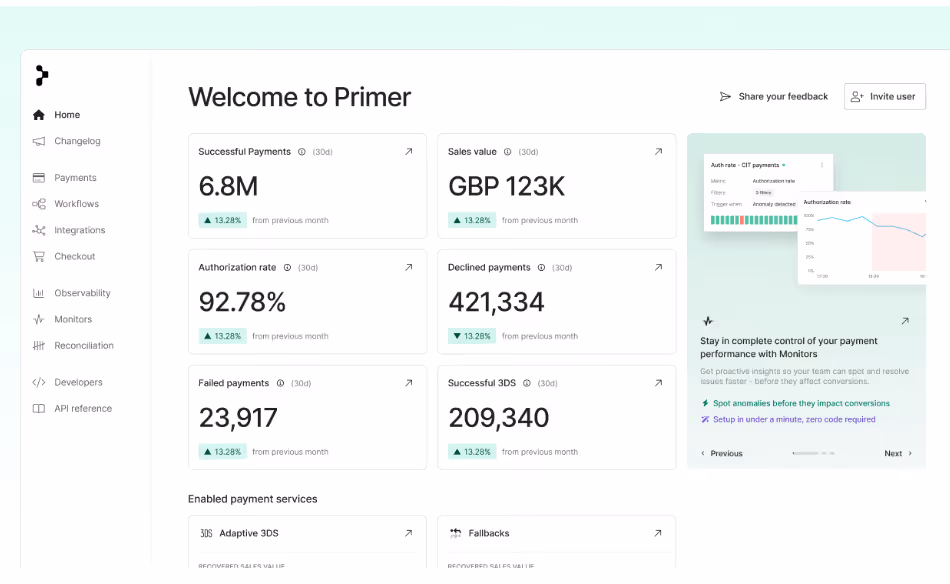
And with Monitors, you don’t need to be constantly checking your dashboards. This tool allows you to set up alerts when certain metrics reach a certain threshold, such as when authorization rate drops in a specific country.
With Primer, you can also:
- Experiment and validate decisions with built-in A/B testing: Create custom payment journeys in drag-and-drop Workflows, where you can split traffic across processors and test which journeys result in the most optimal performance, for example by trying out different 3DS strategies across PSPs.
- Act on data-backed recommendations by the AI Companion: Able to read every payment in your flow and connect the dots between data, the AI companion acts like an extension of your payments team. It tells you what’s changing and why so that you can act in time, and it can also set up optimizations, experiments, and routing changes for you to review and deploy as you see fit.
- Reduce cross-border fees and stay in control of your global cash flow with Global Accounts: Get local accounts in more than 20 countries and currencies to receive payments without having to open multiple bank accounts. With 95% same-day transfers, 200+ payout countries supported, and 30+ local collection countries available, this feature simplifies how you convert and move money: all in one place.
- Reconcile from a single source of truth across your PSPs and payment methods: Instead of relying on manual downloads and spreadsheets, make use of intelligent matching and data standardization across processors to reduce reconciliation time by 90% and close faster.
Primer gives merchants complete control and flexibility over their payment operations: that’s why we’re trusted by leading merchants like Printify, Get Your Guide, and New Look
Optimize payment KPIs based on comprehensive and actionable insights with Primer
Getting your payment metrics right isn’t about tracking more data. It’s about tracking the metrics you can act on and understanding how they work together.
When you define success clearly, benchmark against the right competitors as well as your own performance history, and validate your decisions through A/B testing, payments stop being reactive and start becoming a real driver of growth.
But none of that is possible without full visibility. With one unified layer for observability, experimentation, and orchestration, Primer gives you the clarity you need to optimize payments in a way that actually makes a difference.
Reach out to Primer to find out how we can help you.
FAQs: Payment metrics and KPIs
What are the most important payment metrics to track for merchants?
Most merchants start with a core set of payment metrics that reflect performance across the checkout process and the full lifecycle of payment transactions. That usually includes conversion rate, acceptance rate, payment failures (including the total number of failed transactions), fraud and chargeback rates, refund rate, and the total cost per successful transaction. If you take both debit and credit card payments, it’s also worth tracking these metrics by payment method, since performance and costs can differ.
How do I choose the right payment KPIs for my business?
Pick payment KPIs that support better decision-making. A good KPI is actionable: when it moves, you should know which lever to pull, whether that’s changing payment options, adjusting routing across payment providers, tuning fraud detection and fraud prevention, or improving the checkout process. To avoid inefficiencies and bottlenecks, set KPIs at a granular level, like acceptance rate by payment processor or payment gateway, and conversion by market, device, or payment method.
How do I define success when tracking payment KPIs?
Define success in terms of profitability, not just top-line conversion or lower fees. A higher acceptance rate can still be a poor strategic decision if it increases fraudulent transactions, pushes up chargebacks, or raises your total cost enough to reduce profit per successful transaction. The most reliable benchmarks usually come from your own performance over time, especially if you operate across different markets in a global payment setup.
How can I improve conversion without increasing fraud costs?
The goal is to streamline the checkout process without weakening fraud prevention. If you remove friction, you may reduce payment failures and increase acceptance rate, but you also need strong fraud detection to avoid growth in fraudulent transactions and chargebacks. Test changes in controlled ways, watch both leading indicators like acceptance rate and lagging indicators like chargebacks, and track retries so you can see whether you’re recovering failed transactions or just adding processing time and extra cost.
What’s the best payment solution for tracking payment metrics and KPIs?
The best approach is one that standardizes data across payment providers, especially if you use multiple PSPs, a payment gateway, or more than one payment processor. Without a single source of truth, teams waste time resolving reporting mismatches, which creates bottlenecks and slows decision-making.
A unified payments infrastructure like Primer can help you consolidate payment metrics, diagnose payment failures faster, and measure the impact of changes across your payment transactions with consistent reporting.

.png)