
In payments, small tweaks can drive massive gains. Take an ecommerce company I recently spoke with; they ran a simple A/B test: adding a tiny padlock icon to their checkout’s ‘Pay Now’ button.
The result? A 3% to 4% increase in conversions.
This one example proves what a powerful tool A/B testing is for merchants looking to optimize payment performance.
But getting it right isn’t as simple as it seems. While most understand the core concept—comparing two versions to see which performs better—small missteps in test design and execution can lead to misleading results and flawed decisions.
In this guide, we’ll break down best practices for running A/B tests in payments, highlight common pitfalls to avoid, and explain why statistical significance is crucial for making data-driven decisions that truly move the needle.
How to structure a fair and reliable A/B test
The first consideration is ensuring that the test you’re building is fair and reliable.
One common mistake we see merchants make is running sequential tests. For example, they might process payments through Provider A for three months and then switch to Provider B for the next three months.
That’s like judging a marathon runner’s speed by timing them on a windy day versus a calm one. External factors like seasonality, economic shifts, or changes in customer behavior can skew results, making it impossible to isolate the true impact of the switch.
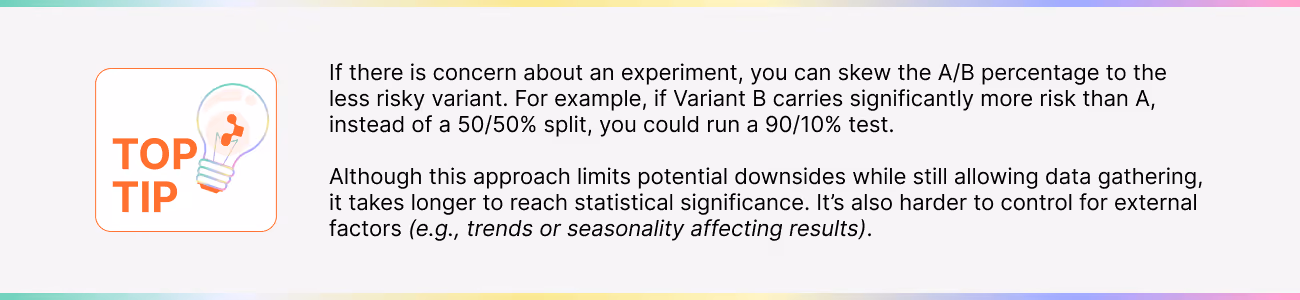
To run a true A/B test, you should randomly split traffic in real-time. For example, you could send 50% of transactions through Provider A and 50% through Provider B, ensuring both variants operate under identical conditions and no bias is introduced between cohorts.

Frequentist versus Bayesian approaches
Before embarking on an A/B test, you must also decide what approach to take.
Generally speaking, there are two schools of thought.
The Frequentist approach
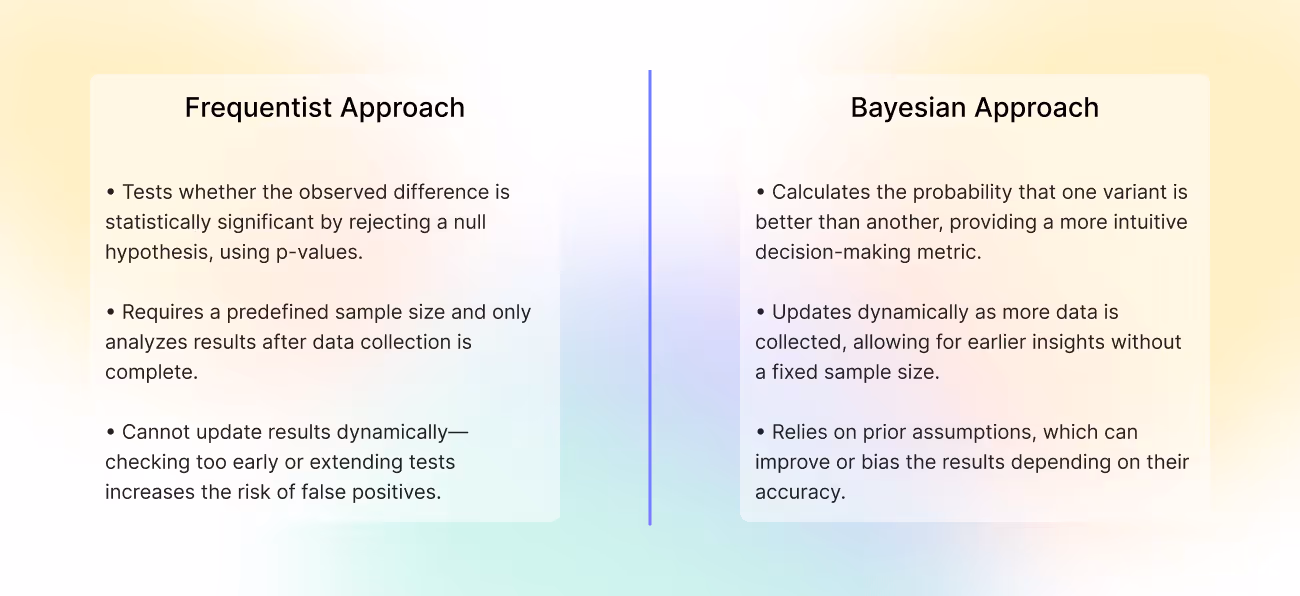
Most people refer to the Frequentist approach when discussing A/B testing. This approach aims to disprove a null hypothesis (e.g., the idea that Processor A and Processor B deliver the same performance) while controlling for acceptable rates of false positives and false negatives.
This approach relies on statistical significance to determine whether an observed difference is meaningful, typically using a p-value at a predefined confidence level—often 95%.
A fundamental requirement in Frequentist testing is defining the sample size before starting the experiment. If you’re testing how a change affects conversion rates, your required sample size depends on the baseline rate and the expected impact. For example, with a 70% conversion rate, detecting an increase to 80% requires only about 330 payments per variant.
But if you’re measuring a smaller change—from 70% to 71%—you’ll need 33,000 payments per variant. The smaller the expected impact, the larger the sample size needed to detect it reliably.
Here’s a handy calculator you can use to calculate your sample size.
Also, you should only analyze your results once this threshold is met to maintain statistical validity. Checking results too soon inflates the risk of false positives, leading to misleading conclusions. Nor should you extend your run time to wait for a statistically significant result.
It’s also important to clarify a common misconception: a p-value is not the probability that Variant B is better than Variant A. Instead, it represents the probability of observing a difference between A and B due to random chance. A lower p-value means that seeing such a result under the null hypothesis would be unlikely, but it does not tell us the probability of being right or wrong.
To ensure valid results in a Frequentist A/B test:
- Identify your target metric and any subsequent health metrics (see below for more information on these)
- Define the sample size based on the baseline rate and the expected impact
- Let the test run uninterrupted and analyze only after collecting the entire dataset.
The Bayesian approach
In contrast to the Frequentist approach, the Bayesian method seeks to calculate the probability that B is better than A. To do so, it assumes that A and B are probability distributions, and we look at the probability of B being better than A.
For example, if a Bayesian model states, “Variant B has a 90% chance of outperforming A,” decision-makers can act based on their confidence threshold or continue collecting data for greater certainty. This probability is arguably more intuitive than a p-value, as it directly answers the question: “How likely is B to be better than A?”
Like the Frequentist approach, you can still define an ideal sample size to test by asking a question like: how many samples do I need to see a 95% chance of B outperforming A? However, you don’t necessarily need to wait for this many samples before conducting your analysis because as more data is collected, these distributions adjust in real-time, making Bayesian testing more adaptive.
However, because these models start with an assumption—called a prior—the results can be influenced by initial beliefs. If prior knowledge is available and reliable, it can speed up decision-making. But if it’s inaccurate, it could mislead the analysis.
In short, both Frequentist and Bayesian approaches are statistically rigorous—they just serve different objectives:
- Frequentists aim to disprove a hypothesis with a pre-set sample size.
- Bayesians calculate a probability and refine it dynamically as more data is collected.
A/B testing network tokenization: measuring the impact for our merchant
At Primer, we don’t just give merchants the tools to run A/B tests—we actively conduct experiments to uncover ways to improve payment performance.
For instance, we tested Network Tokenization on one of our merchants to quantify its impact on authorization rates.
To do this, we ran an A/B test across two payment processors:
- 50% processed with a network token
- 50% processed with the raw PAN (Primary Account Number)
We then compared the authorization rates of both variants to assess whether Network Tokens made a measurable difference.
The result:
The impact of Network Tokens varied between processors:
- Processor A saw a statistically significant uplift, with the authorization rate increasing from 63.2% to 66.3%—a 3.1pp (4.9%) improvement, primarily due to fewer fraud-related declines.
- Processor B showed minimal impact, with auth rates rising slightly from 69.6% to 69.8%, a change too small to be statistically significant.
Given these findings, we recommend different approaches for each processor.
- Network Tokens clearly provide Processor A with an advantage. Shifting 90-100% of traffic to Network Tokens would maximize gains.
- While Processor B's immediate impact was negligible, there could be long-term benefits, such as improved fraud prevention and reduced interchange fees not captured in this test. Therefore, moving forward with Network Tokens may still be worthwhile.
The tradeoff in A/B testing
A/B testing is a powerful way to optimize payments, but it comes with a hidden risk many businesses overlook: regret.
When you test two different payment processors, checkout designs, or fraud strategies, you expose customers to both options, even if one is worse. The disciplined approach is to let the test run its course, gather enough data, and then make a decision. However, during that time, some transactions inevitably flowed through the underperforming variant, leading to lost revenue.
For example, I once spoke with a merchant who wanted to test a solution to reduce their chargeback rate. They ran an A/B test and, after a few days, saw their conversion rate plummet. The drop in conversions caused so much panic that they immediately pulled the plug on the test, cutting it short before meaningful conclusions could be drawn.
Sometimes, the challenges of testing are simply part of innovation. Your risk tolerance should dictate what and how much you test. Regardless, ensure your stakeholders are aligned and confident in the approach.
Protecting against unintended consequences
Another factor to consider is using ‘health metrics’ to guard against unintended consequences. For example, suppose your primary metric is conversion rate, and you’re testing a checkout change to improve it. In that case, you may want to establish additional health metrics—such as refund and chargeback rates—to detect negative side effects.
Of course, these are lagging indicators. While conversion rates update in real-time, chargebacks take weeks or months to surface. That’s why it’s crucial to bake these delays into your test design, ensuring that decisions aren’t made too soon or abandoned too quickly.
When and where to use A/B testing in payments
Nearly every aspect of payments can be A/B tested. Some of the most valuable areas for A/B testing include:
- Payment routing: Comparing processors, acquirers, or failover strategies to optimize approval rates and reduce fees.
- Fraud prevention rules: Testing different fraud detection models to balance risk mitigation with conversion rates.
- Authorization strategies: Adjusting authentication flows (e.g., 3D Secure) to minimize friction without hurting security.
- Checkout UX: Experiment with different payment methods, button placements, or auto-fill features to boost conversions.
- Fallback strategies: Testing different approaches to recover revenue when a payment fails, ensuring minimal disruption to the customer experience.
Traditional (Frequentist) A/B testing isn’t always practical, especially when transaction volume is low. Splitting traffic evenly between two variants may take too long to generate statistically significant results—unless the expected improvement is substantial.
In reality, you can run a rigorous Frequentist A/B test with a small sample size, but only if you’re testing for a high minimum detectable effect. This means setting a clear expectation for how much improvement you need to see.
For startups with lower conversion rates and a focus on major improvements, A/B testing with small sample sizes can still be valuable—as long as they set realistic expectations for what level of improvement justifies the test. These merchants could also apply the Bayesian approach to get faster results.
A step-by-step guide to running a payments A/B test
To get reliable insights from A/B testing, you need a structured approach. Follow these steps to ensure your test produces meaningful, actionable results:
- Define your metrics and decision framework: What are you testing, and what do you expect to happen?
- Determine sample size: Use historical data to estimate how many transactions you need for statistical significance.
- Split traffic randomly: Ensure fair allocation between A and B.
- Run the test for a fixed period and avoid checking results too early (if you use the Frequentist approach).
- Analyze statistical significance: Use p-values (Frequentist) or probability models (Bayesian) to interpret results. You can use free online tools to make these calculations, including ones from dynamic yield and AB Testguide.
- Make a decision: If the result is conclusive, implement the winning variant.

A/B testing is powerful, but only if done right
Top payment teams don’t test occasionally; they make it a habit. Because in payments, the difference between good and great isn’t luck—it’s testing.
A/B testing removes the guesswork, revealing what truly drives conversions. But success requires precision—clear hypotheses, proper segmentation, and statistically valid results.
Rushing tests or acting on incomplete data can be as damaging as not testing at all.

.avif)
.avif)