Dashboards used to be passive. You’d log in, export a CSV, and hope the data told you something useful. If approval rates dipped or a region underperformed, you’d spot it days later, if at all.
But payments have changed. You’re operating across multiple providers, serving global markets, and are expected to optimize constantly. Static reporting doesn’t cut it anymore.
Yet despite this, many merchants are still struggling with fragmented data, limited visibility, and slow feedback loops. Reporting is manual, trends slip through the cracks, and issues are only spotted after they’ve compounded.
It’s why more businesses are upgrading their analytics stack to unify their payments data across processors, tools, and providers. The goal: to monitor performance live, catch issues early, and test faster.
But what should you look for? What dashboard is the right fit for your needs? Read on to find out how to choose the best solution for your business.
Primer is a unified payment infrastructure with a powerful real-time payment analytics dashboard, called Observability. To learn more about what it can do, keep reading or book a demo with Primer.
Three questions to ask when looking for a payments analytics dashboard
When evaluating a payment analytics dashboard, start with these three questions.
1. Does it connect with your current payment stack?
Most merchants today already know the value of a multi-processor strategy. It builds resilience, lifts authorization rates, and gives you the flexibility to optimize for cost and performance across regions.
But there’s a tradeoff. The more providers you add, the more fragmented your data becomes.
To operate effectively, you need a solution that consolidates all your payment data in one place, eliminating manual workarounds and giving you full, real-time visibility.
However, not all payment platforms deliver on that promise. Even some that claim to centralize your data can fall short due to:
- Missing data points: Some tools support multiple payment service providers (PSP) but don’t surface essential metrics, such as 3DS performance, token usage, or network-level decline reasons.
- Inconsistent normalization: Without standardized decline codes or unified reporting logic, it’s hard to compare performance across providers or trust the insights you’re seeing.
- Partial integrations: You may get detailed data from a few card processors, but find gaps in local payment methods or alternative providers, like missing metadata on Klarna, PayNow, or iDEAL transactions.
So our advice is to check the small print. Make sure what’s captured and reported aligns with the outcomes you care about.
2. Does it alert you about payment performance in real-time?
Your analytics dashboard shouldn’t just show you what’s already gone wrong, it should tell you when something’s going wrong, in real time.
That means having the flexibility to set your own thresholds and define what matters, like being alerted if authorization rates for a specific payment method drop below 85% in a given region, or if chargebacks suddenly spike past a certain point.
You shouldn’t have to rely on generic rules or manually refresh your dashboard to catch issues. Real-time alerts should reflect your priorities and only trigger when action is needed, so you’re not drowning in noise.
3. Does it clearly visualize your data, making it easy to share?
Data is only useful when it’s easy to interpret. Interactive charts, graphs, and clean visualizations make patterns and anomalies stand out immediately. You can see the impact of changes at a glance, compare processors side by side, or track performance over time without digging into spreadsheets.
Many dashboards require SQL knowledge or coding skills, which limits access to a few specialists. However, clear and intuitive visualizations open up your payment data to the entire team, enabling stakeholders, leadership, and PSPs to make informed decisions quickly without requiring technical expertise.
Why standalone analytics dashboards often fall short
Some merchants use business intelligence tools to track payments, but these platforms aren’t built for payment operations. They often require developers to set them up and don’t update automatically when you add a new PSP or payment method.
Worse, they separate analysis from action. You can see what’s happening, but you can’t do anything about it from the same platform.
A payment orchestration platform that offers analytics capabilities solves this by providing both real-time analytics and the ability to execute your payment strategy in a single platform.
With payment orchestration, you can:
- Route transactions based on performance, cost, or region
- Add or switch PSPs and methods without developer time
- Unify reporting across your stack, with no need for separate dashboards
Every change you make is reflected automatically. You’re not switching between tools or building custom integrations: you’re working from a single source of truth that powers both insight and execution.
In the next section, we’ll show you the power of this approach by running you through our Observability dashboard.
Read more: 13 payment analytics tricks to outsmart a challenging economy
How Primer Observability gives you the insights you need to analyze and optimize your payment stack
We believe payment teams should have the freedom to adapt, experiment, and grow, without being blocked by outdated systems or slow processes. That’s why we’ve created the world’s first unified payment infrastructure. With Primer, you can connect your entire payments stack through a single API integration, then orchestrate every part of the payment lifecycle without writing code.
Our infrastructure is designed for flexibility, built to scale with you, and powerful enough to put you in complete control.
A crucial part of that control is visibility. Our analytics dashboard, Observability, provides a real-time, 360° view of all your payment data: across every processor, service, and method. It surfaces actionable insights that help you identify patterns, spot issues faster, increase authorization rates, and optimize revenue across the board.
Here’s how it works:
Use dashboards to get in-depth, granular insight into performance impact
All Primer users have access to Observability which offers an overview of the most critical online payment KPIs. These include metrics in categories like:
- Sales
- Refunds
- Authorizations
- Payments
- Declines
- 3DS authentication rates

For more advanced needs, Primer also offers a suite of specialized dashboards. These give you deeper visibility and custom insights to help you fine-tune performance, reduce friction, and unlock more revenue across your entire payment stack. These include:
- Payments dashboard: Take a deeper dive into payment and authorization data across all processors, letting you flag and interpret anomalies on a granular level. View authorization rates and payments created rates broken down by over a dozen different metrics, including payment processor, payment method, card network, merchant ID, BIN, AVS response, currency, and country.
- Sales dashboard: Forecast sales trends and analyze order value across payment methods, regions, currencies, and processors, helping you understand how payments are impacting your revenue.
- Refunds dashboard: Monitor refund patterns to identify potential payment fraud, customer issues, or operational inefficiencies. Filter by processor, region, payment type, and more.
- 3D Secure dashboard: Dig into your 3DS performance. Compare frictionless and challenged flows, analyze the impact of protocol versions, and break down outcomes by initiator, response codes, and network.
- Network Tokenization dashboard: Measure how network tokens perform compared to PANs and see how they impact authorization rates.
- Sales recovery dashboard: See the impact of tools like Fallbacks in real-time. Quantify how much revenue you’re recovering from failed or declined payments.
- Declines dashboard: Standardize decline codes across all providers to get a clear view of why payments are failing, and what to do about it.

Find out more about what you can do with the Observability dashboard in our documentation
Case Study: How Ferryhopper used Observability to refine their 3DS strategy
Ferryhopper, an online travel agency based in Greece, lets users book ferry tickets to more than 500 destinations with over 100 ferry operators. As it expanded across borders to over a dozen countries, the company needed more ways to optimize costs and boost performance.
By using Observability data to pinpoint the causes of 3DS friction, Ferryhopper realized it needed to apply 3DS more selectively. The company began applying 3DS only to transactions falling under the scope of SCA, and was able to increase its conversion rates by 2%.
Primer data also showed that 3DS could boost authorization rates for certain Google Pay transactions, even where it wasn’t required by SCA. When Ferryhopper began applying 3DS in these specific instances, it was able to prevent about 20% of declines on Google Pay transactions.

Read the full case study here: Charting a new course for payments at Ferryhopper
Stay on top of your payments in real time with monitors
While Observability provides a complete view of your payment data, Monitors keeps you informed about payment trends.
With Monitors, you can set up automatic alerts based on the metrics that matter most to your business.
You can set up:
- Static monitors, that let you define specific thresholds and receive alerts any time a metric falls outside your set range. For instance, you might want to be notified if your 3DS success rate drops below 85% over the course of an hour.
- Dynamic monitors which analyze your historical data to detect irregular activity, even accounting for seasonal fluctuations. For example, if your refund volume suddenly spikes outside of your typical post-sale trend, Monitors will flag it for your team to investigate.

When an alert is triggered, you don’t need to wait for engineering support to investigate. Your Observability dashboards make it easy to pinpoint the issue. And if a payment method or provider is underperforming, you can disable it instantly with just a few clicks.

Primer in action: dealing with payment problems
It’s not enough to know something’s gone wrong; you need to fix it quickly.
Primer gives you the tools to do both: spot problems in real time, investigate them, and take action without needing engineering support.
Here’s an example of how this might work in practice:
1. You get alerted about a problem
You’ve recently added a new processor to support your expansion into Spain. To track its performance, you’ve set up a dynamic Monitor in Primer to watch its authorization rate.
One morning, you get an alert in Slack: approval rates for this processor have dropped 12% below baseline. Revenue isn’t heavily impacted yet, but the alert signals a potential issue that needs attention before it escalates.
2. You investigate with Observability
You open Observability and filter transactions by processor, card BIN, country, and payment method. You quickly notice that the dip is tied to cards issued by two major banks in southern Spain.
To rule out other causes, you check related metrics like chargeback rates and 3DS challenge flows. Everything else looks stable, so you can confidently trace the issue to the processor’s handling of transactions from those issuing banks.
At this point, you reach out to the processor’s support team to investigate further.
3. You adjust routing logic in Workflows
To prevent continued failures, you update your payment routing logic to temporarily bypass the underperforming processor for cards issued by those banks.
You do it in just a few clicks:
- Open Workflows, Primer’s no-code routing tool
- Find the payment flow using the affected processor
- Add a new condition using BIN logic
- Route transactions from those issuing banks to a more reliable provider
- Use Split Utility to keep a small percentage going to the original processor, so you can monitor whether performance improves
You’ve now identified the issue, limited its impact, and implemented a fix: all without opening a ticket or waiting for a release cycle.
Using data to improve your payment strategy
In the previous example, we saw how Primer helps you detect and respond to payment issues in real-time. But we don’t just help you react: we give you the tools to be proactive, and get on the front foot.
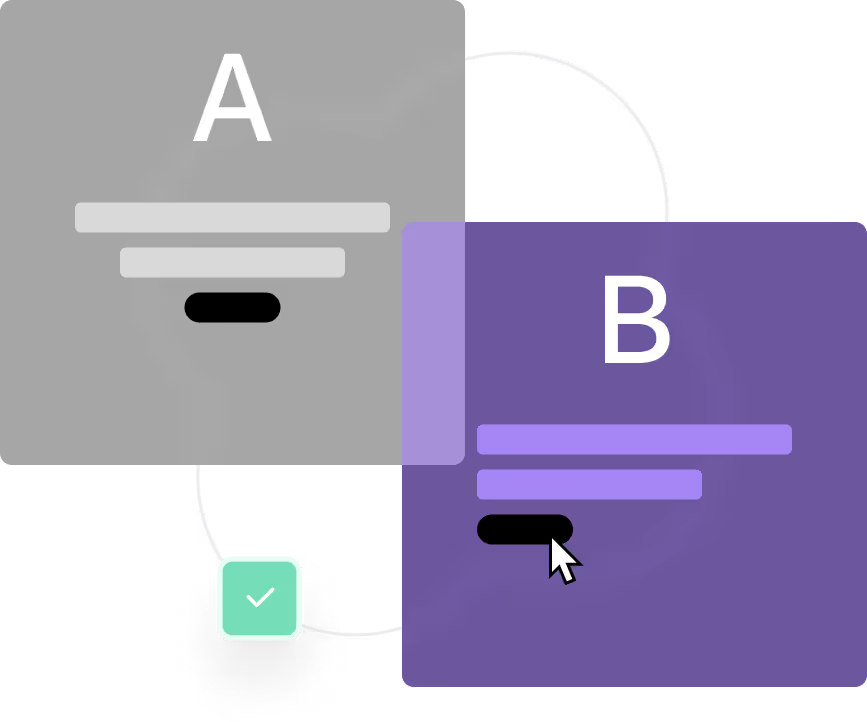
With Primer, you can continuously experiment, iterate, and improve your payment strategy using built-in A/B testing: without needing engineering resources.
Let’s say you’re processing card payments in Germany and want to test whether a new local PSP performs better than your current provider. Here’s how you can set up and run that test with Primer:
1. Define your test
Start by choosing the metrics you want to track. For example, you might want to compare authorization rates between two processors in a specific market.
2. Build test logic with Workflows
Use Workflows and Split Utiltiy to set up a simple A/B test that routes 50% of your German card transactions to your current processor, and the other 50% to the new one.
4. Analyze results in Observability
Get real-time insight into how each processor is performing. With Observability, you can break down results by country, device, card type, and more, so you can pinpoint exactly where one provider outperforms another.
5. Set up Monitors for instant alerts
Use Monitors to stay ahead of issues. Set thresholds for key metrics—like authorization rate, and get alerted when performance starts to diverge between processors. This helps you act quickly when one provider consistently delivers better results.
6. Iterate and optimize
Once you’ve identified the winner, adjust your routing logic in Workflows to send more volume to the better-performing processor.
With Primer, experimentation becomes part of your strategy. You can continuously optimize performance, lower costs, and improve user experience without relying on engineering resources.
This is a simple example of an A/B test, but there is more you ought to know. Check out our guide: Payments A/B testing best practices
Turn observable data into actionable insights, with Primer
Observability gives you a complete view of your entire payment stack in one place. It pulls in data from all your processors, payment methods, and services so you can see what’s happening, spot issues faster, and understand what’s driving performance.
But Primer is much more than just visibility. With built-in alerts, no-code routing, and tools like Universal Checkout, you can actually act on what the data tells you. That might mean adjusting routing logic, launching a new test, or updating how payment options appear at checkout.
Primer gives you the functionality to monitor, test, and improve your payment strategy, without relying on engineers.
Book a call now to get started with Primer
FAQ: Choosing a payment analytics dashboard in 2025
1. What is a payment analytics dashboard?
A payment analytics dashboard helps merchants monitor transactions, authorisation rates, declines, and other key metrics across payment providers. Primer’s Observability dashboard brings all this into one place in real time.
2. Why is real-time payment data important?
Real-time data lets you catch issues before they impact revenue. Primer’s Monitors tool sends instant alerts so your team can investigate and fix problems fast.
3. How does Primer unify payment data across providers?
Primer connects all your PSPs, methods, and services through a single API, standardising data across the stack. Observability ensures consistent, accurate reporting.
4. Can I take action based on analytics in Primer?
Yes. Primer doesn’t just show you what’s happening: it lets you act. You can update routing logic, run A/B tests, or disable underperforming methods instantly.
5. What makes Primer’s dashboard different from standalone BI tools?
Unlike traditional business intelligence tools, Primer’s Observability dashboard is purpose-built for payments. It updates automatically, requires no dev work, and connects insight to execution in the same platform.


