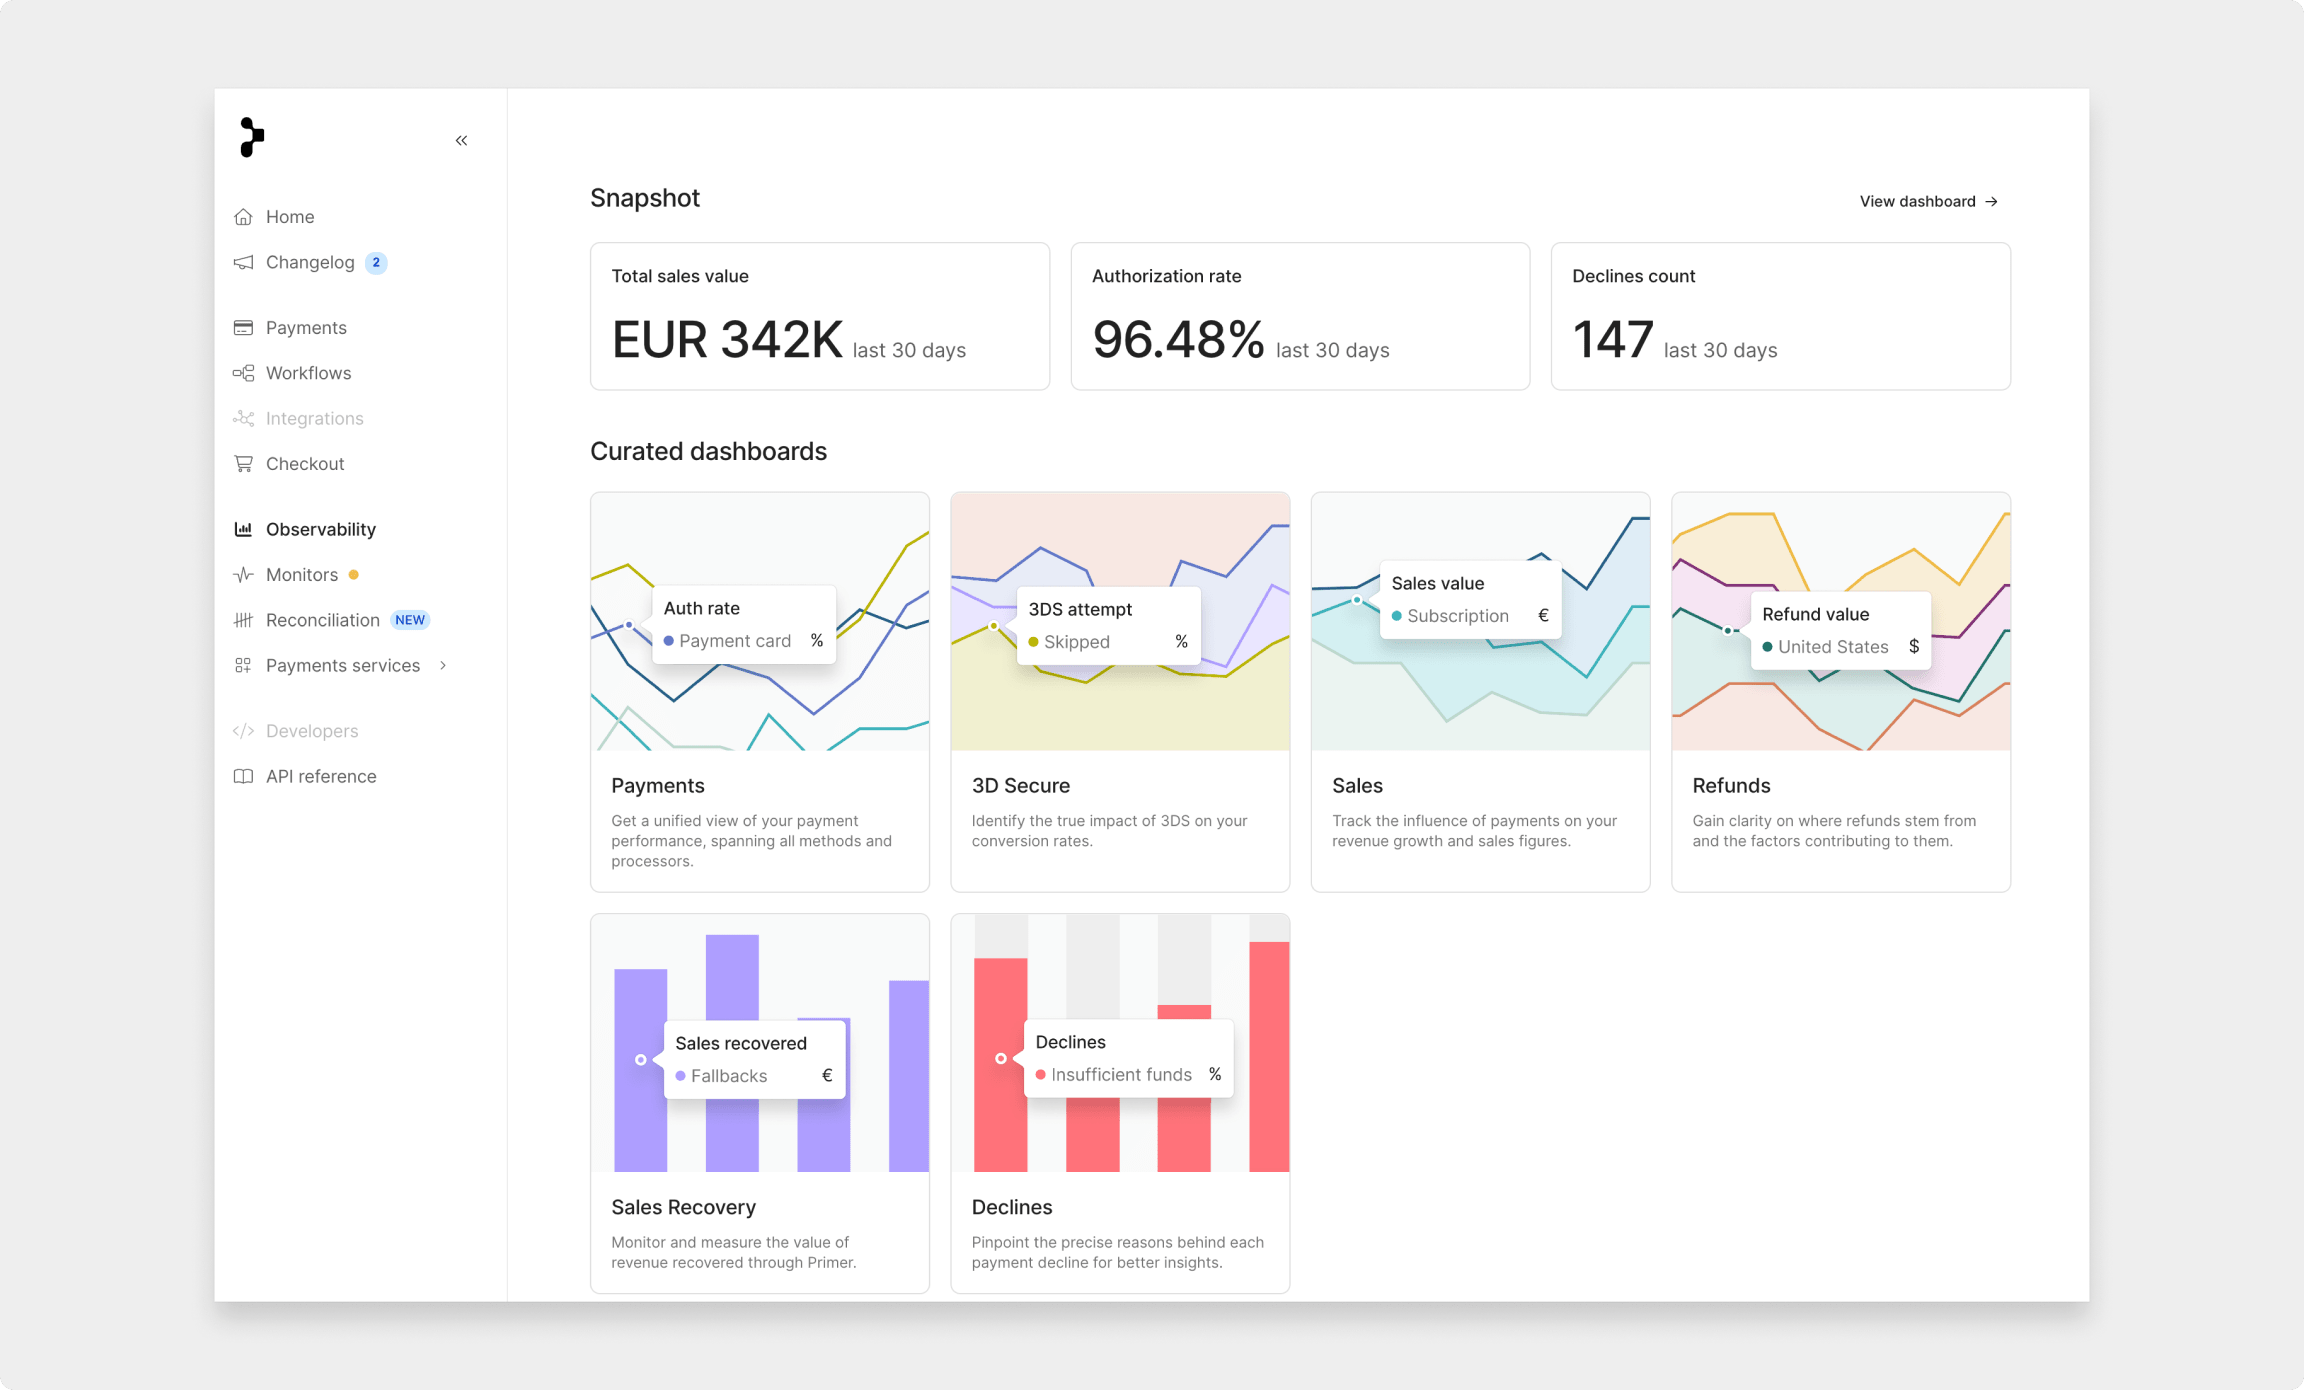
Primer’s curated Dashboards give merchants easy access to all the payment metrics they need to optimize their payments stack effectively. Each dashboard has multiple tabs displaying different metrics and includes multiple charts breaking down the metrics into various dimensions.

ℹ️

Only the Snapshot dashboard is available for all users. All other dashboards are exclusive to Observability PRO users.


Snapshot

An at-a-glance overview of key metrics. The Snapshot dashboard is designed to give users a high-level view into each aspect of their payments performance. This dashboard is great if you need to share some high-level figures with internal stakeholders.

Snapshot

  • Sales: Shows the total sales value and count for the period. Sales value is the monetary amount of payments that are settled or partially settled. Sales count is the number of payments that are settled or partially settled.
  • Refunds: Shows the total refund value and refunds as a percentage of sales value for the period. Refunds value is the monetary amount of refunds that have been processed. The % of sales value calculation is performed against the sales value on the payment creation date.
  • Authorization: Shows the authorization rate and the total count of authorized payments for the period. The authorization rate is the count of successful payments divided by the total number of payments. Includes payments where the payment reached a processor only.
  • Payments: Shows the total count of payments for the period.
  • Declines: Shows the breakdown of declined payments by the reason returned in the response of the processor for the period. Declined payments are payments where a request to a processor was made and was unsuccessful. The decline reason is the detailed decline response returned on declined payments.
  • 3D Secure: Shows the 3D Secure authentication rate and the total number of payments where 3D Secure was used for the period. 3DS attempts are the number of payments where 3D Secure was initiated. The authentication rate is the number of successful 3DS attempts divided by the total number of 3DS attempts. Excludes processor 3DS.

Payments (PRO)

A deep dive into your payment & authorization data across all processors. The Payments dashboard is most merchants’ first port of call when looking to analyze payments in granular detail. Primer aggregates the data across all processor and payment methods and standardizes it into a unified format for easy analysis. The authorization rate and number of payments created are then broken down across multiple payment dimensions to highlight any anomalies or optimization opportunities quickly.

Authorization rate

  • Auth rate & count: Shows the authorization rate and the total count of authorized payments for the period. The authorization rate is the count of successful payments divided by the total number of payments. Includes payments where the payment reached a processor only.
  • By Processor: Breakdown of auth rate by payment processor.
  • By Payment method: Breakdown of auth rate by payment method.
  • By Card network: Breakdown of auth rate by card network. For payment cards, Apple Pay & Google Pay payments only.
  • By Merchant ID: Breakdown of auth rate by merchant ID.
  • By Issuer country: Breakdown of auth rate by issuer country. For payment cards, Apple Pay & Google Pay payments only.
  • By Issuer region: Breakdown of auth rate by issuer region. For payment cards, Apple Pay & Google Pay payments only.
  • By Currency: Breakdown of auth rate by currency.
  • By 3D Secure response: Breakdown of auth rate by 3DS response.
  • By Payment type: Breakdown of auth rate by payment type, e.g., e-commerce or recurring.
  • By Account funding type: Breakdown of auth rate by the account funding type of the underlying payment card, e.g., credit or debit. For payment cards, Apple Pay & Google Pay payments only.
  • By Account usage type: Breakdown of auth rate by the account usage type of the underlying payment card, e.g., business or consumer. For payment cards, Apple Pay & Google Pay payments only.
  • By CVV response: Breakdown of auth rate by card verification value (CVV) response. For payment cards, Apple Pay & Google Pay payments only.
  • By AVS response (postal code): Breakdown of auth rate by address verification system (AVS) response (postal code). For payment cards, Apple Pay & Google Pay payments only.
  • By AVS response (street address): Breakdown of auth rate by address verification system (AVS) response (street address). For payment cards, Apple Pay & Google Pay payments only.
  • By Issuing bank: Breakdown of auth rate and count of declined payments by issuing bank. For payment cards, Apple Pay & Google Pay payments only.
  • By BIN: Breakdown of auth rate and count of declined payments by bank identification number (BIN). For payment cards, Apple Pay & Google Pay payments only.

Payments created

  • Payments created: Shows the total count of payments for the period.
  • By Payment status: Breakdown of payments count by payment status.
  • By Processor: Breakdown of payments count by payment processor.
  • By Payment method: Breakdown of payments count by payment method.
  • By Card network: Breakdown of payments count by card network. For payment cards, Apple Pay & Google Pay payments only.
  • By Merchant ID: Breakdown of payments count by merchant ID.
  • By Issuer country: Breakdown of payments count by issuer country. For payment cards, Apple Pay & Google Pay payments only.
  • By Issuer region: Breakdown of payments count by issuer region. For payment cards, Apple Pay & Google Pay payments only.
  • By Currency: Breakdown of payments count by currency.
  • By 3D Secure response: Breakdown of payments count by 3DS response.
  • By Payment type: Breakdown of payments count by payment type, e.g., e-commerce or recurring.
  • By Account funding type: Breakdown of payments count by the account funding type of the underlying payment card, e.g., credit or debit. For payment cards, Apple Pay & Google Pay payments only.
  • By Account usage type: Breakdown of payments count by the account usage type of the underlying payment card, e.g., business or consumer. For payment cards, Apple Pay & Google Pay payments only.
  • By CVV response: Breakdown of payments count by card verification value (CVV) response. For payment cards, Apple Pay & Google Pay payments only.
  • By AVS response (postal code): Breakdown of payments count by address verification system (AVS) response (postal code). For payment cards, Apple Pay & Google Pay payments only.
  • By AVS response (street address): Breakdown of payments count by address verification system (AVS) response (street address). For payment cards, Apple Pay & Google Pay payments only.
  • By Customer ID: Breakdown of payments count by customer ID.

Sales (PRO)

Sales trends and forecasting metrics. This dashboard provides insights into key revenue metrics and helps users manage sales effectively. The values in this dashboard are represented in the default currency of the Primer account and can be converted using the Observability dashboard conversion.

Sales Value

  • Total: Shows the total sales value for the period, representing the monetary amount of payments that are settled or partially settled.
  • By Processor: Breakdown of sales value by payment processors.
  • By Payment Method: Breakdown of sales value by payment method.
  • By Merchant ID: Breakdown of sales value by merchant ID.
  • By Currency: Breakdown of sales value by currency.
  • By Payment Type: Breakdown of sales value by payment types.
  • By Order Country: Breakdown based on the country of the order passed with the payment request.

Sales Count

  • Total: Shows the total sales count for the period, representing the number of payments settled or partially settled.
  • By Processor: Breakdown of sales count by payment processors.
  • By Payment Method: Breakdown of sales count by payment method.
  • By Merchant ID: Breakdown of sales count by merchant ID.
  • By Currency: Breakdown of sales count by currency.
  • By Payment Type: Breakdown of sales count by payment types.
  • By Order Country: Breakdown based on the country of the order passed with the payment request.

Average Order Value

  • Overall: Shows the average order value of the sales settled or partially settled for the period.
  • By Processor: Breakdown of average order value by payment processors.
  • By Payment Method: Breakdown of average order value by payment method.
  • By Merchant ID: Breakdown of average order value by merchant ID.
  • By Currency: Breakdown of average order value by currency.
  • By Payment Type: Breakdown of average order value by payment types.
  • By Order Country: Breakdown based on the country of the order passed with the payment request.

Refunds (PRO)

Insights on refund trends across processors and payment methods. This dashboard helps merchants understand the sources of their refunds. Values are shown in the Primer account's default currency and can be converted via the Observability dashboard conversion.

Refunds Value

  • Total: Displays the total refund value and its percentage of sales value for the period. The calculation of the % of sales value is against the sales value at the time of payment creation.
  • By Processor: Breakdown of refund value by payment processors.
  • By Payment Method: Breakdown of refund value by payment method.
  • By Merchant ID: Breakdown of refund value by merchant ID.
  • By Currency: Breakdown of refund value by currency.
  • By Payment Type: Breakdown of refund value by payment types.
  • By Order Country: Breakdown based on the country of the order passed with the payment request.

Refunds Count

  • Total: Displays the total refund count and its percentage of sales count for the period. The % calculation is based on the sales count at the time of payment creation.
  • By Processor: Breakdown of refund count by payment processors.
  • By Payment Method: Breakdown of refund count by payment method.
  • By Merchant ID: Breakdown of refund count by merchant ID.
  • By Currency: Breakdown of refund count by currency.
  • By Payment Type: Breakdown of refund count by payment types.
  • By Order Country: Breakdown based on the country of the order passed with the payment request.

Average Refund Value

  • Overall: Shows the average value of processed refunds.
  • By Processor: Breakdown of the average refund value by payment processors.
  • By Payment Method: Breakdown of average refund value by payment method.
  • By Merchant ID: Breakdown of average refund value by merchant ID.
  • By Currency: Breakdown of average refund value by currency.
  • By Payment Type: Breakdown of average refund value by payment types.
  • By Order Country: Breakdown based on the country of the order passed with the payment request.

3DS Secure (PRO)

A detailed view into 3D Secure performance and errors for Primer 3DS payments. The 3D Secure dashboard provides users with granular details into their 3D Secure payments. Merchants can identify successful 3D Secure authentications and investigate potential issues. Optimizing 3D Secure conversion is as vital as the authorization rate. This dashboard is an essential tool for that purpose.

3DS Attempts

  • Count: Total payments using 3D Secure, excluding processor 3DS.
  • By Response Code: Breakdown by response codes.
  • By Error Code: Technical error breakdown.
  • By Transaction Status: Breakdown by transaction status.
  • By Transaction Status Reason: Reasons for unsuccessful attempts.
  • By Protocol Version: Analysis by 3D Secure protocol version.
  • By Initiator: Breakdown by 3D Secure initiator.
  • By Issuer Country: Issuing bank's country.
  • By Currency: Breakdown by currency.
  • By Customer ID: Analysis by customer ID.

3DS Authentication Rate

  • Overall Rate: The ratio of successful 3DS attempts, excluding processor 3DS.
  • By Protocol Version: Breakdown by protocol version.
  • By Card Network: Analysis by card network.
  • By Issuer Country and Region: Insights based on issuing bank's country and region.
  • By Currency: Breakdown by currency.
  • By Account Funding and Usage Type: Insights based on funding type and usage type.
  • By Initiator: Breakdown by 3D Secure initiator.
  • By Issuing Bank and BIN: Analysis by issuing bank and BIN.

Sales Recovery (PRO)

Gain insights on sales recovered through Primer. Merchants can recover sales that might have otherwise failed using Primer's tools. The dashboard showcases the revenue saved by using Primer, displayed in the default currency of the Primer account.

Overview

  • By Method: Total monetary value recovered through Primer.
  • Payments Count: Number of recovered payments via Primer.
  • Recovery Rate: Ratio of successful recoveries to attempted recoveries.

via Fallback Processor

  • Value: Monetary value of recovered payments.
  • Count & Rate: Total recovered payments and their recovery rate.
  • Initial Decline Reasons: Reasons triggering a fallback.
  • Recovery Decline Reasons: Reasons for unsuccessful fallbacks.
  • By Processor: Breakdown by recovery attempts and successful recoveries.
  • By Merchant ID: Analysis by merchant ID.

via Adaptive 3DS

  • Value: Monetary value of recovered payments.
  • Count & Rate: Total recovered payments and their recovery rate.

Declines (PRO)

A comprehensive breakdown of decline reasons. The dashboard enables merchants to understand payment declines, facilitating improved success rates. Primer unifies decline codes across all processors and payment methods for easy analysis and comparison.

Declines

  • Overview: Breakdown by the processor-provided reason during the period.
  • Rate & Count: Decline ratio and total count.
  • By Processor: Analysis by processor.
  • By Payment Method: Breakdown by payment method.
  • By Merchant ID: Analysis by merchant ID.
  • By Currency: Breakdown by currency.
  • By Payment Type: Analysis based on payment type.
  • By 3DS Response: Insights on 3DS response codes.
  • By Card Details: Analysis by card network, issuer country, issuer, funding type, usage type, and CVV response.